plot() can be used to provide a bar plot of an incidence object. Due
to the complexities with automating plotting it is some what experimental in
nature and it may be better to use ggplot2 directly.
Arguments
- x
incidence2 object.
- y
Not used.
Required for compatibility with the
plot()generic.- width
numeric.Value between 0 and 1 indicating the relative size of the bars to the interval.
Default 1.
- colour_palette
function.The color palette to be used for the different count variables.
Defaults to
vibrant(see?palettes).- border_colour
character.The color to be used for the borders of the bars.
Use
NA(default) for invisible borders.- na_colour
character.The colour to plot
NAvalues in graphs.Defaults to
grey.- alpha
numeric.The alpha level for color transparency, with 1 being fully opaque and 0 fully transparent
Defaults to 0.7.
- fill
character.Which variable to colour plots by.
Must be a
grouporcountvariable and will mean that variable is not used for facetting.If NULL no distinction if made for plot colours.
- legend
character.Position of legend in plot.
Only applied if
fillis not NULL.One of "right" (default), "left", "bottom", "top" or "none".
- title
character.Optional title for the graph.
- angle
numeric.Rotation angle for text.
- size
numeric.text size in pts.
- nrow
integer.Number of rows used for facetting if there are group variables present and just one count in the incidence object.
Numeric values are coerced to integer via
as.integer().- n_breaks
integer.Approximate number of breaks calculated using
scales::breaks_pretty().Numeric values are coerced to integer via
as.integer().Default 6L.
- show_cases
logical.if
TRUE, then each observation will be shown individually in a square format.Normally only used for outbreaks with a small number of cases.
Defaults to
FALSE.- ...
Not currently used.
Value
A
ggplot2::ggplot()object.
Details
Faceting will occur automatically if either grouping variables or multiple counts are present.
If there are multiple count variables, each count will occupy a different row of the resulting plot.
Utilises ggplot2 so this must be installed to use.
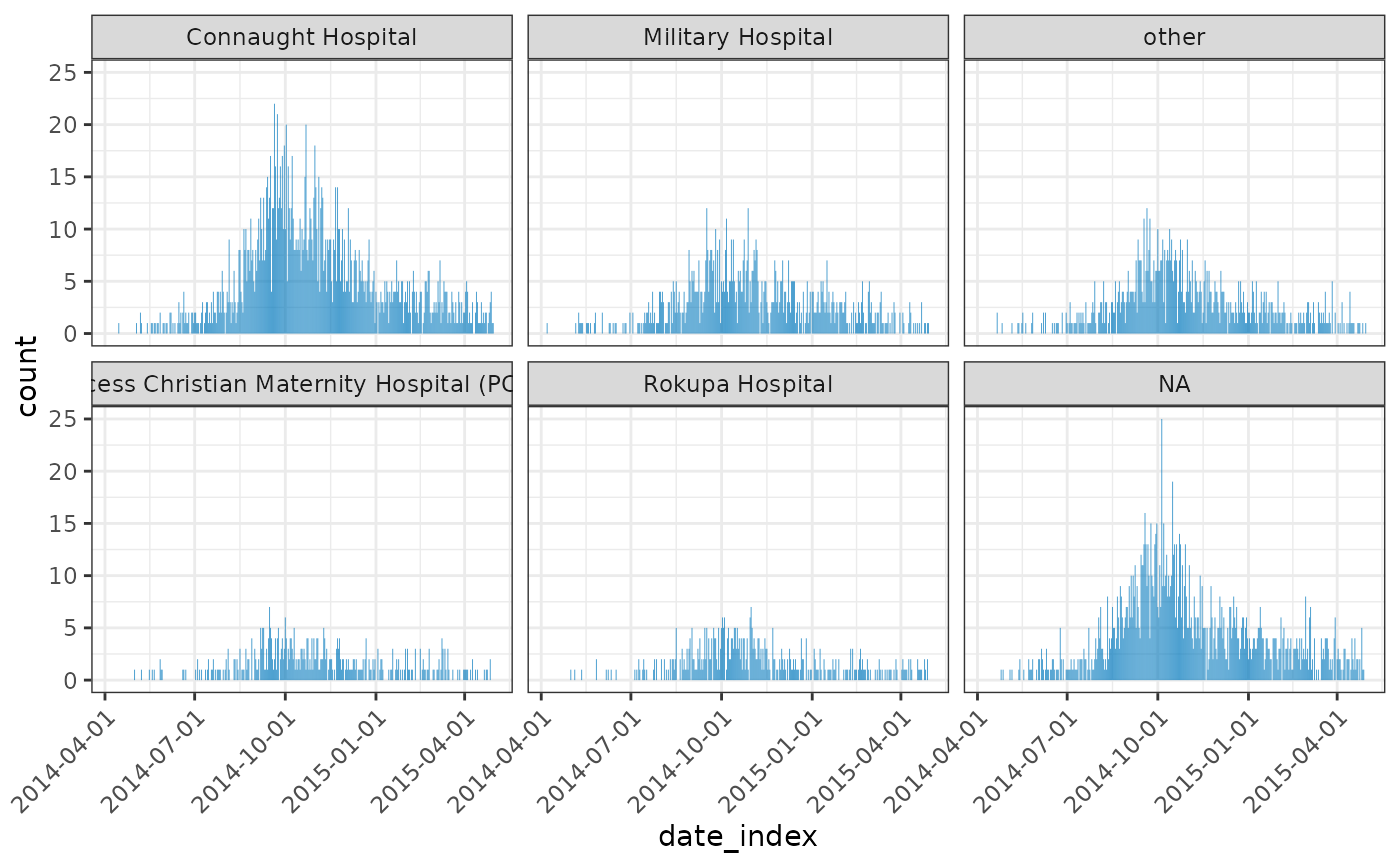
Examples
.old <- data.table::setDTthreads(2)
if (requireNamespace("outbreaks", quietly = TRUE) && requireNamespace("ggplot2", quietly = TRUE)) {
    data(ebola_sim_clean, package = "outbreaks")
    dat <- ebola_sim_clean$linelist

    inci <- incidence(dat, date_index = "date_of_onset", groups = "hospital")
    plot(inci, angle = 45)

    inci2 <- regroup(inci)
    plot(inci2)
}

data.table::setDTthreads(.old)